By Ryan Speers, Paul Li (Two Six Labs), Sophia d'Antoine, Michael Locasto (SRI) | June 9, 2020
This is the first post in a series that describes how we built tools to rapidly identify and characterize “format extensions”: modifications and new feature additions in parsers of complex formats. In this puzzle, we were given a set of binaries and a few input files – in this instance PDFs. Our task was to precisely characterize any new feature(s) present in the binaries and describe how the input files triggered them. Moreover, our goal was to build tools to enable a human to do this faster and/or more completely than they could previously. Our approach was to make the best use of the inputs that triggered modified behaviors, with a combination of fine-grained static binary diffing and execution trace and memory trace analysis.
Introduction: Why focus on parsers?
Although modification-triggering inputs can be notoriously non-trivial to find (and especially so when diffing bare patched binaries), such inputs are nevertheless often available from fuzzing or can be found in large corpora. Even so, combining the information these inputs can provide with other analyses such as static binary or trace diffing has not been a focus of any tools we could find.
We set out to develop a new kind of tools that are aware of the fact that we are diffing or tracing not just any code – but specifically parsing code, that is, code intended to extract a specific expected format structure from the input bytes and to pass the extracted object for some processing such as rendering an image.
We tend to think of data files as an inert pile of bytes. This belief is far from true, particularly when considering complex formats like PDF. The input is very much “alive” in the sense that it drives the logic. We encourage you to think of valid or semi-valid inputs as successful fuzzing attempts that more or less produce mostly normal or benign behavior.
Understanding some weird bug or behavior quirk in a software reader or renderer is often an exercise in understanding the input document’s labyrinthine structure rather than merely the application logic1.
If you need no convincing that any input to a complex parser can act as a program, click here to skip the introduction.
For complex formats, engineers are offered a punishing task: synthesize correct code from an impenetrable (or occasionally non-existent!) specification and a handful of “good” samples. It should not be surprising that the resulting logic is hard to characterize, or that it occasionally behaves strangely. Explaining crazy differences in the apparent behavior of programs is a quite common type of puzzle that gets handed to technical people. This can be both vexing and fun (see 500 mile email). Users usually describe a pile of symptoms (some irrelevant) and show the end result: the software crashes, or prints weirdly, or flashes some screen and gets stuck, or otherwise behaves in an unexpected way.
However, understanding why software behaves differently in one context versus another is a difficult exercise. Opening the file with your version of the program on your computer doesn’t display any of these quirks. What gives? Why is my program behaving differently than yours?
There are lots of potential reasons why software that is apparently the same on the surface might behave differently from one environment to the next: minor software version differences, timing effects, the results of opaque compiler decisions and optimizations, natural differences between two different implementations of the same ISA, etc. The typical techniques we use to understand these differences (such as examining output or external behavior and comparing timing or other performance information) hardly scale to characterize the full range of suspected new behaviors.
It is often tempting to shrug off these concerns. We know that finding an explanation for weirdness can be a long, labor-intensive, and frustrating search. However, what do you do when “WORKSFORME” isn’t a viable option? How do you begin to find – and then fully characterize – what is going sideways? Sure, you have at your disposal modern debugging, disassembly, and reverse engineering tools, but you’re literally hunting a few instructions in a huge code base you have no familiarity with. How do you know what you should be looking for?
To achieve enlightenment, we must look beyond just understanding the code. The crucial missing piece is actually in the input: what in the input files is driving the program to this weird condition the user is seeing? And here, modern tools are lacking. Input files, whether they are programs or scripts themselves, or “passive” data formats like images, movies, audio, PDF, or other documents are a complex jumble of non-trivial syntax and semantics.
Even with a well-defined file format, implementing parsers is difficult. This complexity only grows with ambiguous specifications, countless additional features, and legacy malformed files that still need to be parsed. As security researchers, we often spend a lot of time looking into the internals of libraries in products we are assessing – and parsers are no exception.
In this blog series, we’ll walk through different tools that are available to reverse engineers, and compare their output against the tools we created and used for this challenge. We hope you’ll join us in seeing some interesting findings and where specialized tools can highlight parser changes that are not easily apparent to human analysts and other tools.
The First Exercise
This blog series is based around an exercise run as part of Dr. Sergey Bratus’ DARPA Safe Documents (SafeDocs) program.
For this simple exercise, we were given a set of executable binaries
derived from a known version of the libpoppler library. These
executables were binary builds of libpoppler and its utilities
(e.g., pdftops, pdftocairo, pdftotext) that were modified to
support two new file format features beyond the PDF specification.
To simplify our task in this exercise, we were also provided with 10 PDF files that exercised the two added features (five for each feature). Of course, in the real world, such files may not always be available; the exercise scenario assumed that such files have already been identified out of a large corpus.
One might approach this challenge in the traditional way, which is to use state-of-the-art reverse engineering tooling to identify differences between the two binaries. This is commonly done, for example, to identify binary differences arising from patches made in response to n-day vulnerabilities. Binary differencing is non-trivial in the sense that even small or innocuous code changes, or seemingly unobtrusive compiler flags, can easily cause coarse-grained file comparison tools to fail – in the sense that the reported differences are large and intractable.
As such, binary differencing needs to operate at a level of abstraction much more precise than just the set of bytes making up the executable2. The binary must be understood in terms of the ABI sections, code structure, and program semantics3.
One Method for Finding Differences: Control Flow Analysis
The main objective of a control flow analysis is often to find if there is new or modified code that represents new logic. Here we list some of the current “on-the-shelf” approaches to conducting this analysis and their associated challenges:
- BinDiff & Diaphora: As probably the most advanced widely-used tools for solving this problem today, we will discuss each of these tools in detail below, as a comparison case to our method.
- Diffing objdump/readelf output: One may manually inspect the diff of the outputs from such tools in order to find structure differences like added and removed sections, changed permissions, string and section table entries, the entry point, and other ELF meta-data/header4. This involves sifting through an often large amount of differences, without any help from the tool as to which changes are relevant. For example, a shift in addresses causes many differences – how do you sort through these? How do you determine which are related to each other and can be accounted for as a group? Recall that small changes in a word or byte value can be reflected in many locations.
- LLVM static control flow graphs: Comparing static control flow graphs of the logic is tempting, but is deceptively difficult. One must pick the right level of abstraction; certain control flow changes may not be visible at the function level; some tools that produce CFGs do so only on some IR that does not match the machine code in the binary. In addition, comparing graphs is no easy task, and subgraph matching is generally an NP-hard problem.
To tackle this problem while trying to solve some of the aforementioned challenges, we decided to take into account data inputs that trigger differences in program behaviors. Although such inputs might be hard to obtain in general (and specifically so in the case of diffing patched binaries), they are often available from fuzzing, corpora analysis, crash dumps, and “WORKSFORME” conundrums. We wanted to make the best use of such data when available.
Specifically, we developed tooling to focus on comparing tagged basic blocks that are observed executed in a parser-aware control flow that is one layer of abstraction above the basic instruction-level control flow, and aims to learn about sequences of “parsing actions” that are typical for input-parsing code.
Examples of such actions might be “parsing a PDF name at file offset X” or “parsing a floating point value at file offset Y”5. For this exercise, we explored whether we could learn anything by comparing the sequence of “parser actions” of the original and modified parsers.
Note that automatically deducing parser actions from any source or binary
is an extremely ambitious goal for the future. In the meantime, we
have manually annotated the binary and source of libpoppler by
adding machine-readable tags to enable further tag-based analysis.
One of the neat things we’ve been able to do is automated tag
propagation based on code similarity using Hashashin.
Control Flow Analysis - Tagged Function Comparison
For this analysis, we tackled it in three stages:
- Applying binary tags to common libraries, and producing a tool to propagate these tags to other binaries (Hashashin);
- Collecting memory traces of parser execution against input data, correlating them with the tags, and applying a simple implementation of Longest Common Substring to identify differences;
- Human analysis of the resulting correlations.
This analysis rapidly highlighted an address (2ad5b8) in the modified
libpoppler binary, which lies within the function Lexer::getObj().
It is, in fact, the first basic block in a case statement that handles parsing a PDF name token.
A human analyst seeing this output was able to quickly see that this trace
suggested that the second parser was recognizing a name token while the first wasn’t.
To help visualize what this tool showed, you can follow in the below image:
- In the upper left, you see our tags ordered by how they were reached in the trace on the unmodified and modified parsers. Specifically, the red box highlights tags that were only seen on the modified parser.
- Following the addresses on the lines labeled #1, #2, and #3 in the trace, we show the corresponding basic blocks in the bottom right. As these only get traversed in this state on the modified parser, yet those blocks exist on the unmodified parser as well, we look at the incoming edge in the graph.
- In the upper right, you see the basic block uses a jump table to decide where to go.
- By looking at this table, we can immediately see a new entry added to it in the modified parser. This was the change we were looking for!
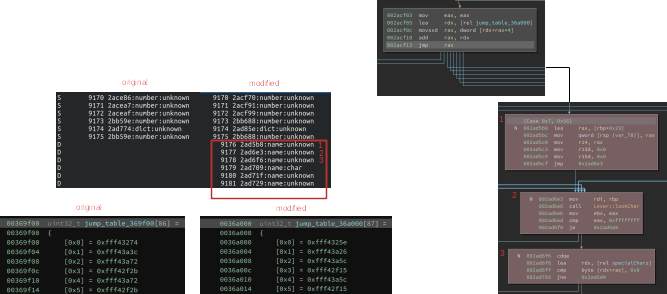
Note that the tool rapidly led us to a minor variation in the jump table that would not show up in an analysis of changed symbols, functions, or code diffing, as we demonstrate below.
Comparing to BinDiff & Diaphora
As discussed above, although comparing two binaries to identify a difference can be easy, it is actually only easy in cases where several major assumptions hold:
- actual code changes are few and well-localized,
- the same compiler, flags, and tool chain were used to produce the binary,
- no obfuscation or other protections were used to produce the binary.
In essence, binary differencing can be made easy if there is a great deal of consistency: in binary sections, in the number and types of symbols, in the memory layout, in the used virtual addresses, in dynamic linking tables, in the limited spread of code changes outside a few basic blocks, etc. Any inconsistency in these properties can cause an overwhelming blow-up of false positives that tooling or analysts will have to deal with and sift through in order to identify the real candidate set of program behaviors that represent new or modified functionality. By focusing on two invariant aspects of a program (memory type activity and parsing actions), our approach seeks to avoid getting caught up in these potentially overwhelming variations.
To provide a baseline comparison for our tools, we nominated a control team, who did not share their findings with the rest of us until the exercise was completed. The control team chose to use BinDiff and Diaphora, the two popular binary diffing tools, and also opted to correlate warnings produced by the unmodified parser while running on the modified files with the output of BinDiff.
Long story short, our control team did not catch all the modifications made to the PDF parser.
Since BinDiff, by design, focuses on control flow and executable blocks, it did not alert our control team of data segment modifications.
As you can see in the BinDiff screenshot below, it detected only a change to a function opIntermediateLineTo, which
is a different modification, totally unrelated to the modification found by our tooling above, which we’ll discuss in future posts.
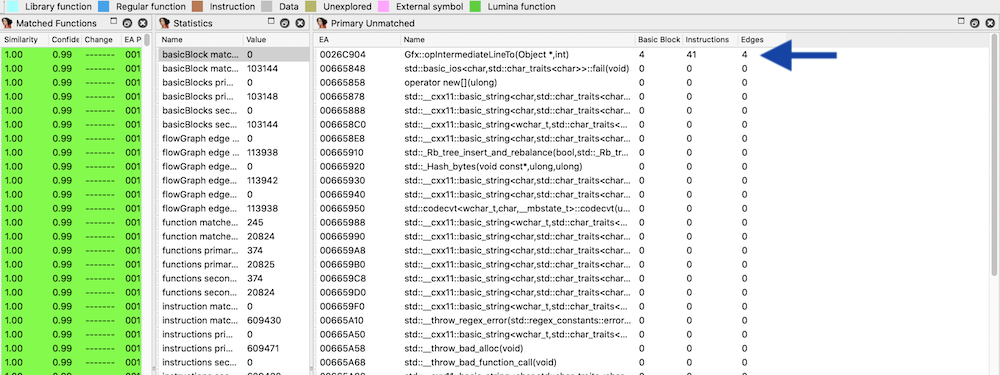
As we can see from this example, the new feature was implemented via slight modifications to the data segment, specifically to the dictionary key name lookup table stored there. In this way, a new feature added to the PDF renderer that was “invisible” to BinDiff.
Diaphora has more up-to-date CFG diffing algorithms than BinDiff, but it operates similarly in that it only looks at control
flow modeling and determines if basic blocks have been added or modified.
While this tool proved equally successful in discovering the above mentioned opIntermediateLineTo modification, it similarly did not alert us to the data modification.
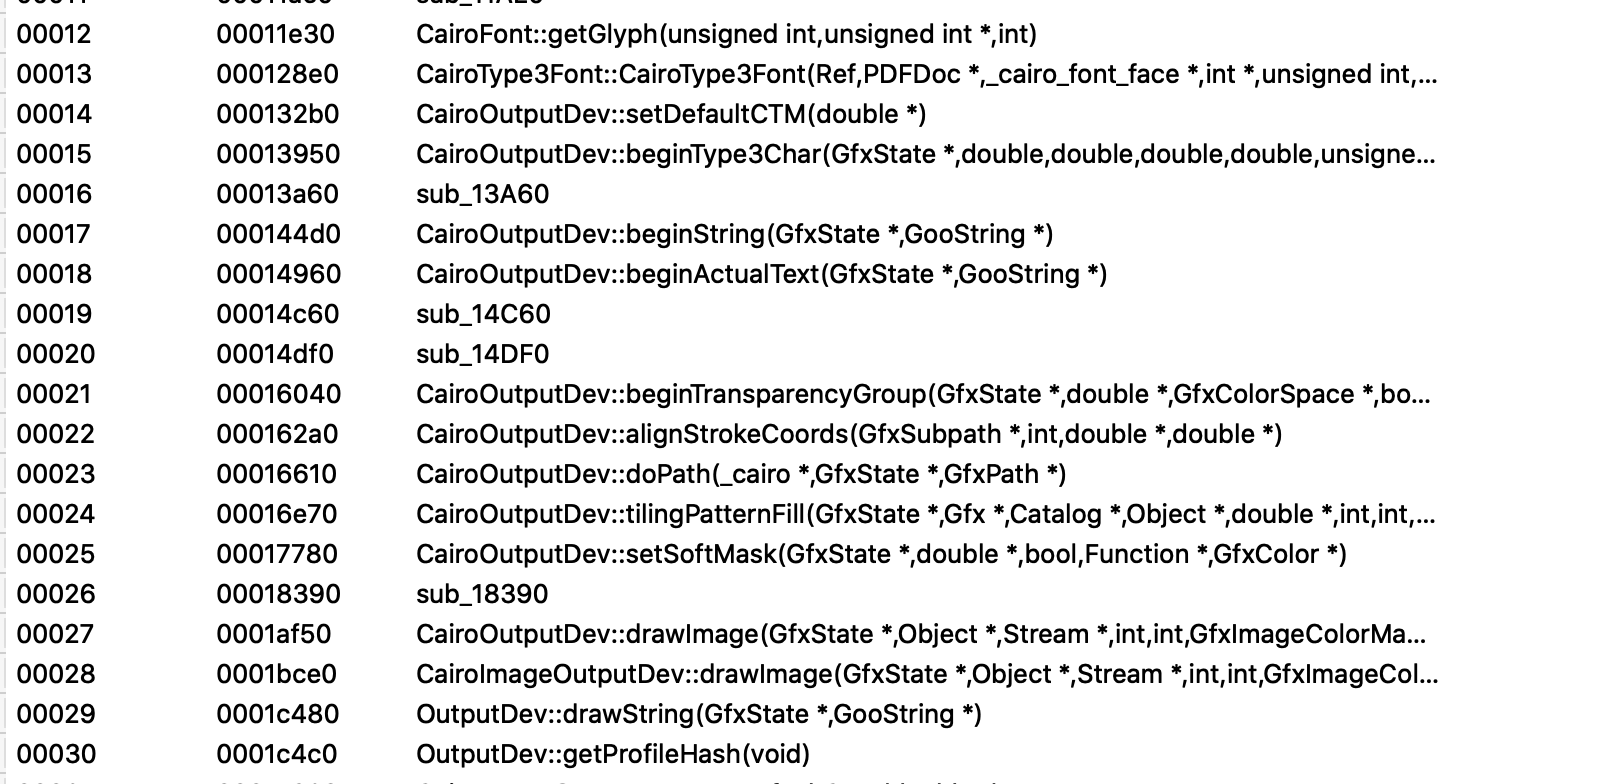
The below image shows a Diaphora’s output on pdf2cairo, and our analysis of these results shows they do not include the ‘dl’ token changes.
To be clear, neither BinDiff nor Diaphora are to be faulted for this. These excellent tools are designed for specific analysis scenarios that are different from ours. It just so happens that to understand complex format behaviors we need tools to look at both data and code changes, and at their relationships, all at the same time.
Our automated tooling improves on existing tools in that it goes beyond static analysis of executable code, to capture the semantic changes of the renderer’s execution at runtime as it processes a PDF file, resulting in a fuller understanding of the new behaviors.
Technical Details of our Approach
You can skip this section if you don’t want to follow the step-by-step process the tool uses to produce the results discussed above.
For the binary tagging, we used Binary Ninja’s “user tag” feature,
which allows us to attach one or more tags at each instruction. Each
Binary Ninja tag is a (type, data) pair, where the type is a
(possibly user-defined) label and the data is an arbitrary string.
Generally speaking, we used the type to indicate what type of PDF
structure is being parsed, and the data to indicate how it is being
parsed. We defined types corresponding to various low-level PDF
syntactic constructs, for example “array” (for a PDF array) and “name”
(for a PDF name). Example data values (that is, “how” some PDF structures are
processed) include “lib”, which
indicates that a string comparison was performed via a call to a library
function such as memcmp(), and “range”, which indicates that a range
check took place.
We’ll talk more about these tags and how we modeled parsing actions in a future blog post.
As mentioned above, for the parser differential task posed by this exercise, we explored whether we could learn anything by comparing the sequence of parser actions between the original and modified parsers.
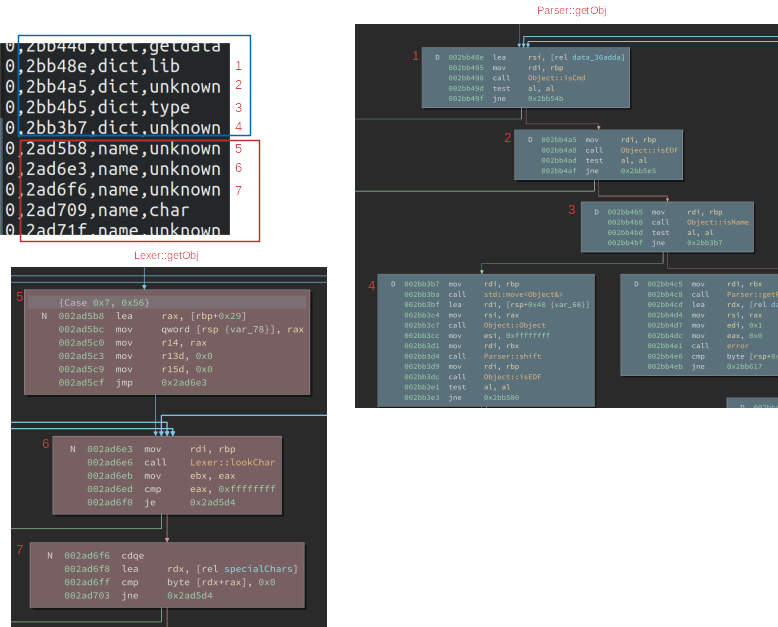
We wrote a Pintool to correlate the execution of a binary parser with the set of instruction tags to produce tag traces, which are a sequence of triples (instruction address, tag type, tag data) as shown below. We aligned them with images of the corresponding basic blocks for reference:
To propagate our manual tags to the modified libpoppler binary, we
used River Loop’s tool Hashashin, which looks for similar functions
across two binaries and transfers tags from one to the other. River
Loop’s past work with Hashashin has been described in detail
here and here. To make the two traces more
similar, we also used Hashashin to propagate our manual tags to an
unmodified libpoppler binary that we compiled from source.
For a very basic comparison between two traces, we ignored the
addresses in each trace event and concatenated the tag type with the tag
value to get a single value. We then looked for long stretches of
consecutive matching values between the two traces. To do this we
used a simple implementation of Longest Common Substring. Once
a long matching sequence is found, the process is applied recursively to
the unmatched portions before and after the matched segments. For
example, this process returned the following matching segments (each
triple (i,j,n) means that Trace 1 and Trace 2 match for n entries
starting at offsets i and j, respectively):
[(0, 0, 9176), (9176, 9221, 15), (9192, 9236, 10), (9207, 9250, 20655), (29862, 29945, 49), (29912, 29994, 76), (29991, 30071, 16), (30008, 30091, 11), (30030, 30105, 45), (30080, 30150, 15), (30095, 30167, 431), (30526, 32970, 5641), (36167, 38646, 29), (36197, 38675, 36), (36236, 38711, 62), (36298, 38775, 28), (36369, 38805, 13), (38069, 38818, 20783)]
In the example below, there are long matching stretches at the beginning and the end of the traces—which should indicate similar parsing actions being taken by both parser versions. The relatively shorter matches in the middle reflect the different actions that the two parsers are performing for some portion of the file. Looking at the first place where the two traces diverge:
S       9171 2acea7:number:unknown      9171 2acf91:number:unknown
S       9172 2aceaf:number:unknown      9172 2acf99:number:unknown
S       9173 2bb59e:number:unknown      9173 2bb688:number:unknown
S       9174 2ad774:dict:unknown        9174 2ad85e:dict:unknown
S       9175 2bb59e:number:unknown      9175 2bb688:number:unknown
D                                       9176 2ad5b8:name:unknown
D                                       9177 2ad6e3:name:unknown
D                                       9178 2ad6f6:name:unknown
D                                       9179 2ad709:name:char
             ...                                  ...
D                                       9217 2ad6e3:name:unknown
D                                       9218 2ad6f6:name:unknown
D                                       9219 2ad5d4:name:unknown
D                                       9220 2ad777:name:unknown
S       9176 2bb26e:dict:unknown        9221 2bb358:dict:unknown
S       9177 2ace2b:number:char         9222 2acf15:number:char
S       9178 2ace31:number:char         9223 2acf1b:number:char
S       9179 2ace3b:number:unknown      9224 2acf25:number:unknown
S       9180 2ace41:number:unknown      9225 2acf2b:number:unknown
The address 2ad5b8 in the second trace (modified libpoppler) lies
within the function Lexer::getObj(), and is in fact the first basic
block in a case statement that handles parsing of a PDF name token. So
this trace suggests that perhaps the second parser is recognizing a
name token while the first parser isn’t.
As we demonstrated above, using a tool that looks for differences in binary blocks alone would not find this. Supplementing the static analysis with a dynamic trace, focused on parsing-action blocks (via tags), provided additional context to assist the reverse engineer.
When we later compared our tag traces with the Memory Difference Analysis discussed
above, we saw that it was indeed the flow to the 2ad5b8 basic block
that had been modified.
Incidentally, Hashashin was able to apply the
“name” tag to this instruction only because the modification occurred
strictly inside the jump table leading to that instruction. If
Lexer::getObj() was modified less subtly, Hashashin may not have
propagated tags to the modified function. In that scenario, the tag
trace difference might have been less informative.
We spotted this sort of tag trace difference for one of the new features. The other feature did not exhibit any tag trace differences.
Conclusion
We hope that this has given you a brief introduction to one combination of static and dynamic analyses that our team applied to tackle the challenge of understanding differences in complex parser behaviors. Keep an eye out for our next post, where we will discuss:
- What we found using our memory difference analysis tools;
- A walkthrough of our control flow analysis using the “YARN” tool;
- More details on what we did for our control case via manual reverse engineering;
- Details about how our scalable recognizer harness produced results that assisted inspection;
- A summary of what changes we identified, and which techniques were useful for each.
We feel that parsing-aware, data-centric methods for analyzing opaque binary code artifacts show promise, because they help combine the benefits of understanding control flow with those of understanding the structure of complex input grammars.
River Loop Security works heavily in applying program analysis techniques to solve real-world problems in cybersecurity, from research projects such as DARPA’s SafeDocs program to commercial penetration testing engagements where we audit source code or binaries to find vulnerabilities.
We encourage you to contact us if you have any questions or comments based on this post or have questions about applying binary analysis to solve your cybersecurity challenges.
In Dr. Sergey Bratus’ DARPA SafeDocs Program, we are working with a number of performers towards a collective goal – to comprehend file formats, automatically derive their safe subsets that can be securely parsed, and also produce secure verified parsers for these subsets.
This work was done in collaboration with our Meriadoc teammates from SRI, Two Six Labs, and Narf Industries. River Loop thanks our teammates for the great collaboration and research, and for helping prepare parts of this blog post.
This material is based upon work supported by the Defense Advanced Research Projects Agency (DARPA) under Contract No. HR001119C0074. Any opinions, findings and conclusions or recommendations expressed in this material are those of the author(s) and do not necessarily reflect the views of the Defense Advanced Research Projects Agency (DARPA).
-
We refer the interested reader to a reverse-engineering exercise of Microsoft’s RTF parser: Disappearing bytes: Reverse engineering the MS Office RTF parser. ↩︎
-
A basic example of this is the use of a cryptographic hash, where a single bit change will produce a different hash value, even if this bit change is present in a piece of meta-data like the compiler identification string or a timestamp. ↩︎
-
We note that our Hashashin tool is built precisely for this purpose: making fine-grained comparisons of the similarity of collections of basic blocks within an executable file’s structure. ↩︎
-
One could imagine a notional
objdifftool that usesobjdumpfor basic comparisons orobjdump -d -m intelto offer basic block level diffs. ↩︎ -
Overall in the program, our team is exploring the hypothesis that the behavior of each parser can be expressed and analyzed as a sequence of a limited set of “parsing actions” at a more abstract level than that of machine instructions. ↩︎